Since P and S waves travel through rock with different speeds, and they react differently to different types of rocks, they can be used to measure subsurface topology. Because the waves travel all around the earth (and more importantly through the earth) we can use their arrival times and other physical properties to measure something about their paths.
The more dense a material is, the faster waves can travel through it. Thus if the earth were on one solid piece of homogenous material, the velocity of the P and S waves would smoothly increase with depth and decrease again as they became more shallow. The predicted arrival times would be easy and straight forward to calculate.
Since the results of such tests do not work, it must be assumed that the earths density and composition must be changing in places. The first major boundary is between what we call the crust and the
the waves do not appear to arrive at certain
locations on the opposite side of the earth.
The area of non-arrival is called a shadow-
zone.
After you measure enough earth quakes and study the S-waves you discover that there is a spot in the middle of the earth that cannot be penetrated by the S waves. It is roughly spherical and equidistant from the surface. So what absorbs S-waves? >>> "a Liquid or gas!"
If we assume a liquid layer then we can also study P waves as they would also be refracted by the liquid. When we do this, we find that the resultant paths do not correlate with a completely liquid center.
Instead there appears to be a secondary refraction by something more dense than even the first material the wave passes through. A study of the P wave diagrams from many earthquakes provides a picture of a second inner layer that is more dense than anything yet observed.
The second inner layer
is concentric with the first but appears to be a solid of
even more density than the mantle.
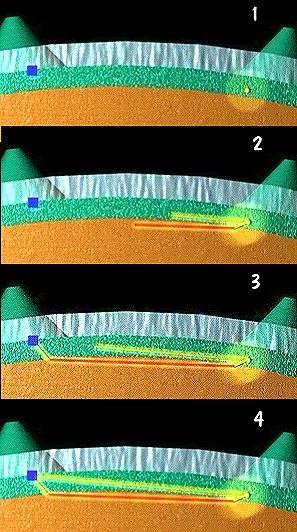
This man was the first to notice that for earthquakes less than 40 KM in depth, there were always two sets of P an S waves. He further differentiated them by their arrival time. The direct set through the crust was slower. The second set actually arrived first, as it was refracted from a layer with greater density and hence higher velocity.
This location has been named after him and is the Mohoroveic discontinuity or M-discontinuity.
It is possible to go into the lab and measure the speed of a seismic wave through various different materials. By comparing a set of speeds with the time durations obtained from actual earthquakes it is possible to make some educated guesses as to the nature and thickness of the crust.
What we find is that OCEAN CRUST is about 10 km thick, and that CONTINENTAL CRUST is between 20 km and nearly 60 km.
By a speed analysis the ocean crust must be made up of basalt and gabbro, while the continental is made up mostly of granite and diorite.
The diagram isllustrates a quake epicenter at the yellow dot (near the discontinuity) creates two sets of waves. The blue square represents the receiving seismology station. The primary set (yellow line) going through the crust (greenish area), but arriving after the second set (red line) moving through the upper mantle (brownish area).
| NEXT | TOC | PREV |